
What is a PE Ratio and Why Should You Care?

Introduction
If you’ve ever looked at a stock chart and wondered, “What’s a P/E?’ you’re not alone. For new investors, the Price-to-Earnings ratio (P/E) is one of the most misunderstood terms in finance. Yet, understanding it can help you decide whether a stock is overhyped, fairly valued, or even a hidden gem waiting to be discovered.
What is PE Ratio?
PE stands for Price-to-Earnings ratio. It’s a measure of how much investors are willing to pay for each dollar of a company’s earnings. In other words, it connects a company’s stock price to its profits.
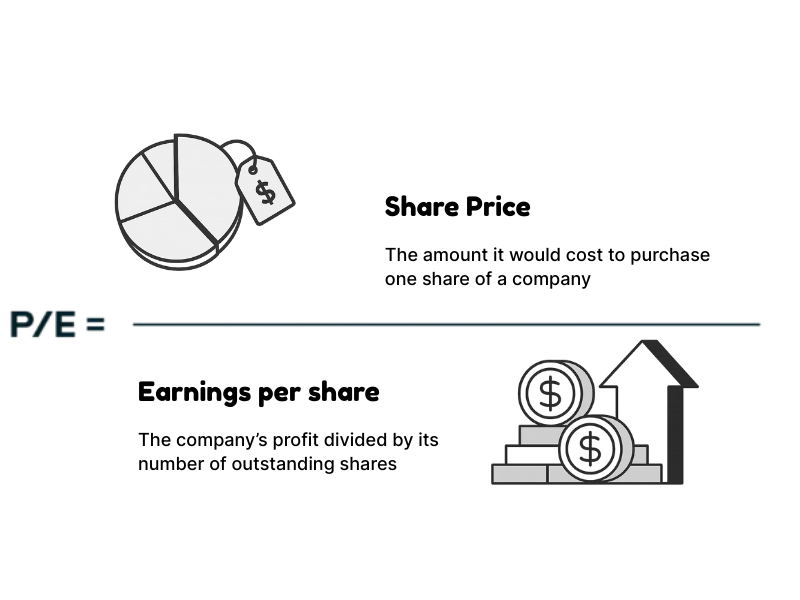
Formula:
PE = Share Price / Earnings Per Share (EPS)
Example:
Let’s say a company’s share price is $10 and its Earnings per share (which is a key financial metric that shows how much profit a company makes for each share of its stock) is $2.
Its PE ratio is $10 / $2 = 5. That means investors are paying $5 for every $1 of earnings.
Why Does It Matter?
The P/E ratio is a quick snapshot of how the market values a company relative to its profits:
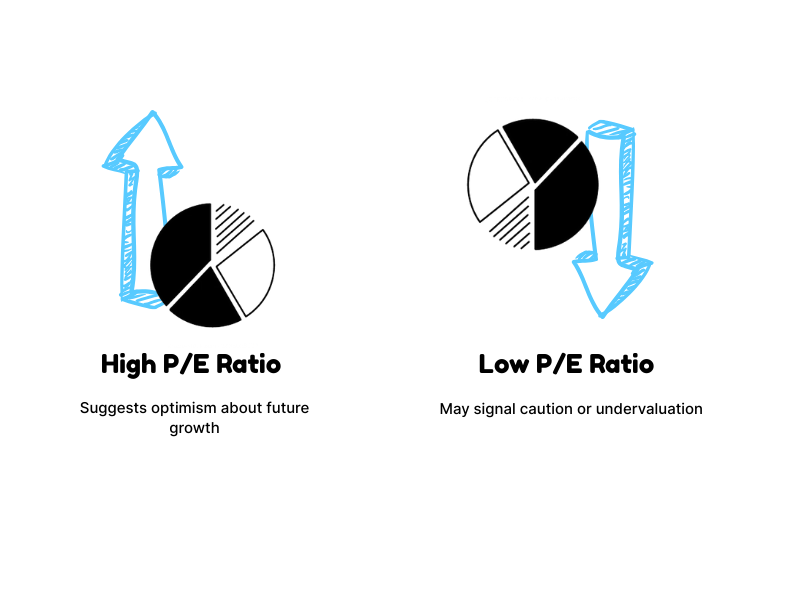
High PE means the stock looks “expensive” relative to its earnings. This could mean investors expect rapid growth in the future. But it might also mean the stock is overvalued.
Low PE might mean the stock looks “cheap”. This could signal undervaluation and a bargain opportunity, or it could reflect deeper problems with the business.
What’s a “Good” PE?
It depends on the industry:
Tech companies often trade at higher P/E ratios because investors expect strong innovation and growth.
Utilities and banks usually have lower P/Es because they grow more slowly and have steadier earnings.
We have linked you a guide with a list of average P/E ratios by industry.
The key is to compare a company’s P/E to:
Industry peers: A company’s P/E should be compared with others in the same industry. What looks expensive in one sector (like utilities) may be perfectly normal in another (like tech).
Historical average: It’s useful to compare a company’s current P/E with its own past levels, because a ratio much higher than its historical average may suggest strong growth expectations, while a lower-than-usual P/E could point to undervaluation or slowing performance.
The broader market: Comparing a company’s P/E to the overall market average helps you see how it’s valued in a wider context, with a higher ratio often reflecting stronger growth prospects and a lower ratio suggesting more stability or potential undervaluation.
Limitations
While useful, the P/E ratio has blind spots. It doesn’t account for:
Future growth potential : A company may look expensive now but grow into its valuation later
Debt levels: A highly indebted company might look cheap but carry high risks.
Earnings consistency: Profits can go up and down. Volatile profits can make the ratio misleading.
Use P/E With Other Tools
P/E should never be your only measure. You can pair it with:
Growth forecasts: This means looking at how much a company’s sales or profits are expected to grow in the future. It helps you figure out whether the current share price makes sense. If a stock looks expensive compared to today’s profits (a high price-to-earnings ratio), that might be fine if earnings are expected to rise quickly. If growth looks slow, then the high price is harder to justify.
Debt ratios: Debt ratios show how much a company relies on borrowed money. A little debt can be helpful because it funds expansion, but too much can make a company vulnerable if profits fall or interest rates go up. These ratios are used to judge how financially healthy and stable a business is.
Industry comparisons: Companies need to be judged in the context of their industry. What’s “normal” in one sector can look completely unusual in another. Airlines, for instance, usually carry heavy debt because planes are so expensive, while software firms often carry very little. Comparing a company’s numbers to its peers helps you see if it’s strong, weak, or average within its field.
How inaam helps
inaam ensures we teach you more terms such as P/E ratio on the Wiki page of our soon-to-be launched app so you can understand whether a stock aligns with your strategy and values. We help you to learn and grow continually just like your portfolios, so you stayed informed and secure throughout your financial journey. Sign up to our waitlist today so you can see what the future of investing looks like.

Final Thought
The P/E ratio is just one number, but learning to read it can transform how you invest. It’s not about chasing “cheap” or “expensive” stocks, but about understanding what the market is telling you and deciding if that story fits your goals.
Note: This is general information, not financial advice. Always do your own research or speak to a licensed advisor before investing.